
2023 Academic Annual Report
Our mission
The mission of University of Phoenix is to provide access to higher education opportunities that enable students to develop the knowledge and skills necessary to achieve their professional goals, improve the performance of their organizations and provide leadership and service to their communities.


Highlights
Excellence for a new era
From our earliest beginnings as the University that changed higher education, University of Phoenix has embraced excellence and innovation. Academic year 2023 was no different.
Like our students, we’re always pressing, never resting. Read on to discover how this came to life in 2023.
Skills-aligned programs
Our students can be confident that their degrees line up with real-world careers. How? As of 2023, 100% of the University’s associate, bachelor’s and master’s degree programs open for new enrollment are now aligned to career-relevant workplace skills.
01/05
Digital badges
Students can post digital badges on their resumés and social media channels as proof of the skills they’re learning. We offer more than 149 distinct badges, and as of December 2023 we had issued more than 450,000.
02/05
HLC accreditation
Building upon 45 years of continuous accreditation by the Higher Learning Commission (hlcommission.org ![]() ), our institutional accreditation was once again reaffirmed in 2023 for 10 more years.
), our institutional accreditation was once again reaffirmed in 2023 for 10 more years.
03/05

- Slide 1
- Slide 2
University timeline 2023


- First set
- Second set
- Third set
Our students
Trailblazers and dream chasers
In Greek mythology, the Phoenix is an immortal bird that rises to new life. Our students can relate. Many of our students went to the school of life before taking their first class.
Almost 8 in 10 work, and most are raising kids. Six in 10 are the first in their family to pursue a college degree.
Somewhere in these overlapping circles of statistics, our students can be found head down, grinding through deadlines and doubts — until, in true Phoenix form, they rise.
Who they are
Phoenixes are as diverse as they are determined. Here’s who they are statistically.
How our students performed
University Learning Goals (ULGs) are a set of five overarching competencies that employers identify as top affective, or “soft” skills, and that University of Phoenix incorporates into its academic programs.
The percentage of student work, aligned to University Learning Goals, that scored 70% or higher by faculty in FY23[1] was:

Cultural competence and ethics

Critical thinking and problem-solving

Communication

Digital fluency

Collaboration
[1] Source: University of Phoenix, 2023, Learning Management System

High student satisfaction
From September 2022 through August 2023, students who took our end-of-course surveys reported high satisfaction in these areas:
Likely to recommend instructors to other students
9/10
Likely to recommend the University to colleague, friend or family
9.2/10
Student experience
University of Phoenix founder Dr. John Sperling knew what it meant to beat the odds. He grew up poor, he battled a learning disability, and he worked his way through school to earn a PhD.
The challenges he faced inspired him to create a better path for students like him. He saw adult learners struggling with rigid class schedules, often taking six to 10 years to earn a degree. And it gave him a revolutionary idea: What if he created a university for working adults?
His experiment didn’t make earning a degree easier — only more practical, with schedules that made sense for working adults and coursework that translated immediately to the real world.
Diverse colleges
100+
programs aligned with 300+ careers, 90% of which are in growing fields
- Set 1
- Set 2
- Set 3
- Set 4
Connecting curriculum to careers
In today’s competitive job market, skills can matter as much as a degree. Our career-focused associate, bachelor’s and master’s programs open for new enrollment align to skills important in today’s workplaces.
Accreditation

continuously accredited by the Higher Learning Commission (hlcommission.org)
Student outcomes
From academic counseling and tools that help students manage their finances to our Career Services for Life® commitment, here are some of the ways we help and support our students as they move toward their academic and career goals.
Career Services for Life®
Students and alumni have lifelong access to career tools and resources, including coaching, resumé building and interview prep. For life.
01/10
Committed academic counselors
Students are supported from day one through day done. Our academic counselors work with students to help them progress toward academic and professional goals.
02/10
- Set 1
- Set 2
- Set 3
- Set 4
- Set 5
Saving students time and money
In FY23, University of Phoenix students saved over $100 million in tuition between discounts, scholarships and other savings. Here are some highlights:
$16.2M
approximate tuition saved through our Prior Learning Assessment
800,000
approximate number of transfer credits applied in FY23
2,900
organizations whose employees were eligible for education benefits
Up to $2,880
in potential alumni savings for a bachelor’s degree (up to $2,200 on a master’s)
Responsible and appropriate borrowing
University representatives assist students (and prospective students) with tuition financing questions prior to and during students’ programs. And our Repayment Management team assists with understanding federal loan repayment options.
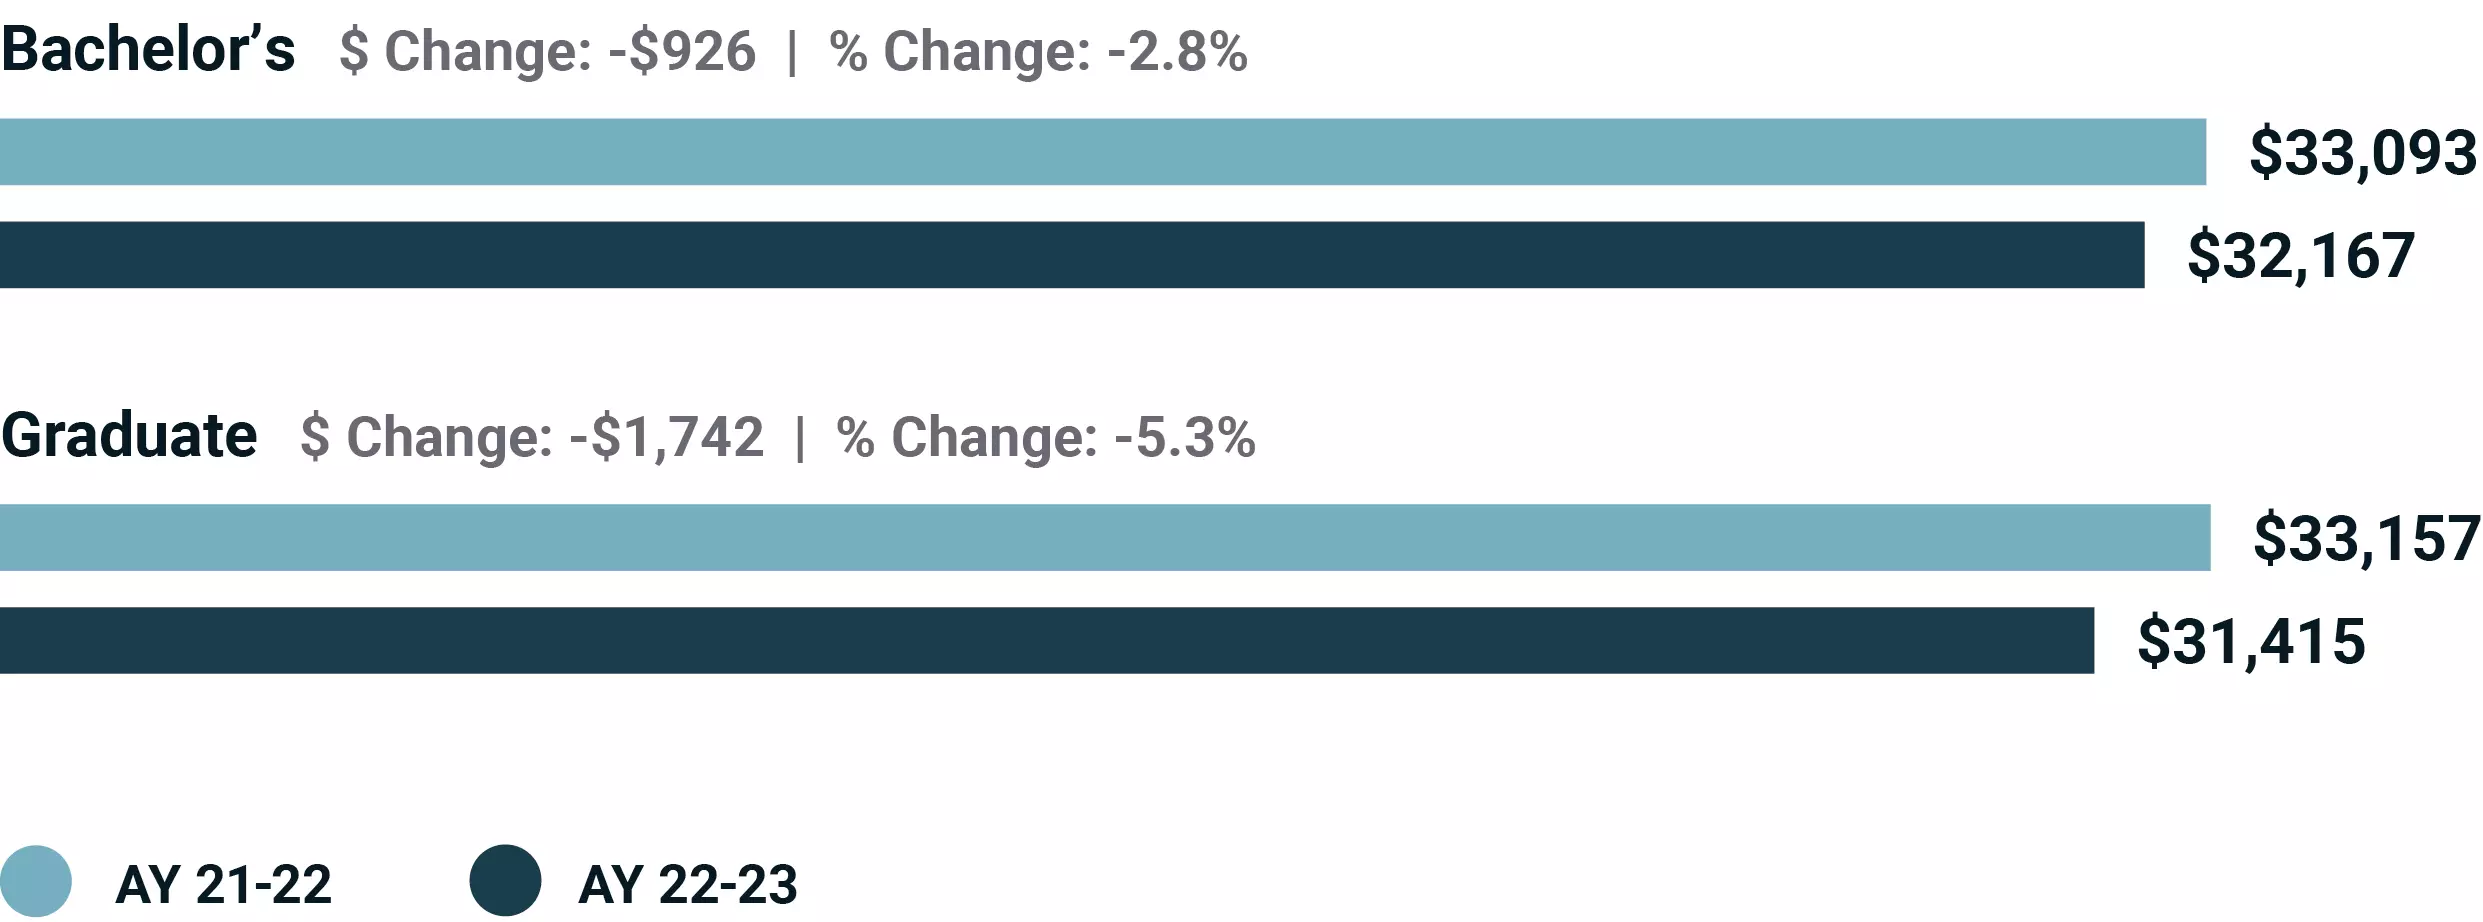
Last year, average student debt levels dropped for all certificate and degree levels at University of Phoenix. Bachelor’s and graduate degree students’ average debt levels are shown here.
University bachelor’s and graduate debt levels

University retention and graduation rates
Data drives our efforts to support student success and improves our understanding of how to help students through the obstacles they face on the way to their degrees.
Since 2017, when the University’s leadership expanded tools to track retention and evolved its focus on retention outcomes, retention rates have experienced an overall positive trend.
University of Phoenix institutional retention rates

Our faculty
We believe students should be taught by accomplished professionals. Our seasoned professionals bring the classroom to life, combining their hands-on work experience with their passion for teaching.
When students rated how likely they would be to recommend their instructor to other students (0 to 10 scale, 10 = extremely likely), our faculty received 9/10.[2]
[2] Survey data is based on 144,080 student responses to our end-of-course survey. All responses were collected between 9/1/22 and 8/31/23.
28.8
years
Average professional experience
15.3
years
Average UOPX teaching experience
Faculty scholarship
Recognizing the role and value that practitioner–scholars bring to the classroom, we encourage a culture of research, scholarship and professional currency among our faculty.
Here is a visual summary from our seven colleges of the breadth of faculty scholarship activities over the year.

College of Doctoral Studies – 23%
College of Business and Information Technology – 22%
College of Nursing – 14%
College of Education – 12%
College of Health Professions – 10%
College of Social and Behavioral Sciences – 10%
College of General Studies – 9%

Our leadership


- Chris Lynne
- John Woods
- Blair Westblom
- Cheryl Naumann
- Eric Rizzo
- Jamie Smith
- Raghu Krishnaiah
- Ruth Veloria
- Srini Medi
- Steve Gross
Our leadership team is deeply committed to helping adult learners reach their education and career goals through continuous innovation that evolves with advances in education, technology and the workplace.
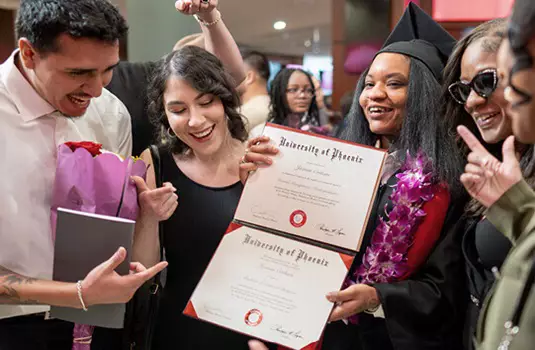
Alumni
We recognize the tremendous achievement of earning a college degree. Most of our students have worked years to reach this goal. In FY23, 93% of our graduates were older than 23, and many are first-generation college students.
We have 50 alumni chapters ![]() , which welcomed 2,010 new members in FY23 and pushed our chapter membership to over 26,269.
, which welcomed 2,010 new members in FY23 and pushed our chapter membership to over 26,269.
FEATURED ALUMNI
Several of our alumni share what becoming a college graduate — and a Phoenix — has meant to them.


- Teaser 1
- Teaser 2
- Teaser 3
Community engagement
At University of Phoenix, we understand that community support and higher education go hand in hand. When we roll up our sleeves to help, we strengthen the communities we serve.
In 2023, the University:
- Sponsored Arizona Forward to promote cooperative efforts to improve the economic vitality in the region
- Collaborated with Arizona Educational Foundation in their mission to promote educational excellence through programs for teachers, administrators, and students
- Continued our long-standing alliance with Valley of the Sun United Way to create a stronger community through workforce development initiatives
- Supported Valley of the Sun YMCA in its mission to help youth and families develop healthy minds, bodies, and spirits
- Supported Future for KIDS, a nonprofit providing programs and camps for youths facing adversity
Business alliances
Our University of Phoenix Workforce Solutions team works with employers to create a range of tailored solutions that attracts new talent, upskills and reskills existing talent, and retains high-performing talent. Depending on employer needs, options can range from full degree programs, competency-based education, six-to-eight-month role-aligned certificates, individual courses, apprenticeship pathways and skill-building workshops.
In 2023 the number of students enrolled at University of Phoenix who were able to continue their education at reduced or no cost based on the University’s relationship with their employer increased by 48.9% over 2022.
We currently offer upskilling education to more than 2,900 organizations ranging from healthcare to telecommunications through employer or benefits provider alliances.
Discover more about how University of Phoenix supports the needs of organizations’ workforces.
Thank you
This is just a snapshot of the work we did in 2023.